3) Tutorial - Understanding the database structure
1) Data integration
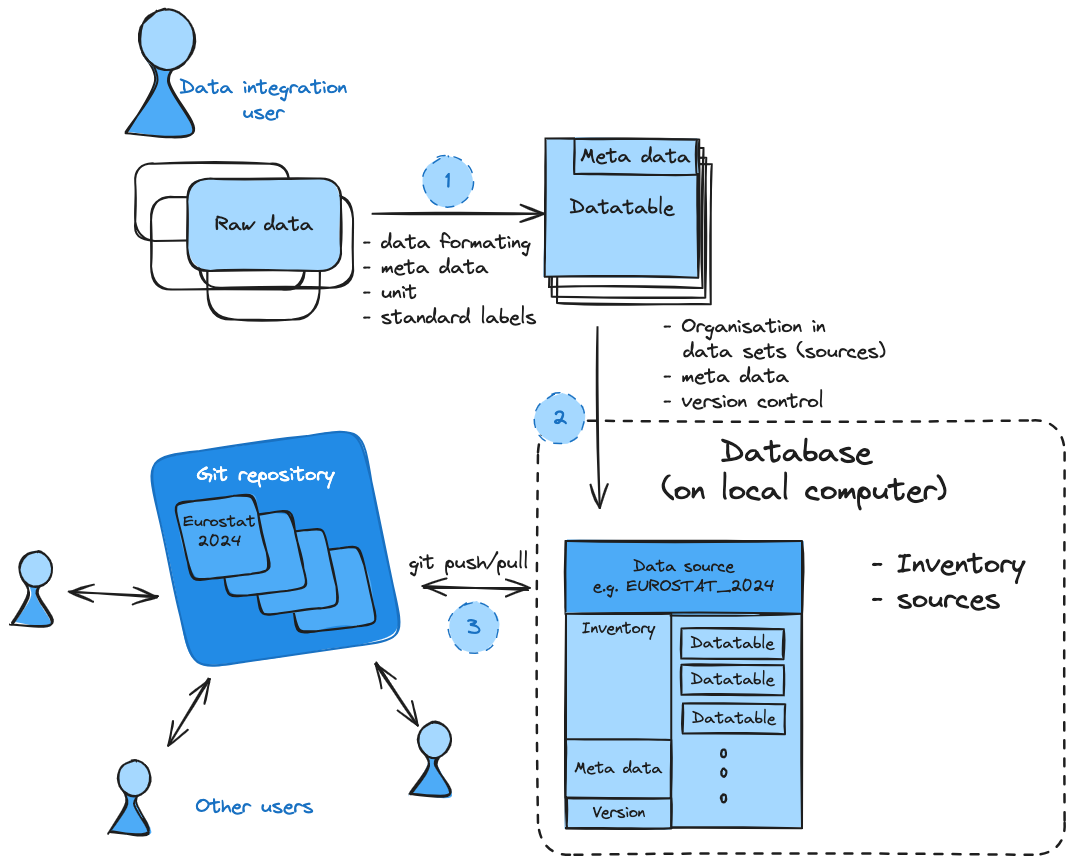
As done in the first two tutorials, always the firsts step is the conversion of the data
into the required data fromat and aligning to the naming convention. The data is separated
into homogeneous datatables that only consist on variable and with that a set of meta information
for all data values for variable regional and temporal extend.
Please not, that the consisstency in meta data might require to split data in different datatables, e.g. if the same data is switching between historic values to for example a projection, which should be indicated in the meta data as different scenarios (historic vs projection), however, the user itself is adviced to maintain the useful level of consistency.
2) Organising data in individual sources (data sets)
Data sets (including all data from on souce and release) are organized as sources in datatoolbox. Each data set can contrain an arbitrary number of datatables reflecting different variables and scenario combinations. In the background, datatoolbox does create a git repository for each new source, that has its own meta data, inventory of datatables and is versioned using git.
import datatoolbox as  dt
dt.admin.switch_database_to_testing()
print(dt.core.DB._get_source_path('Numbers_2022'))
Each source directory does follow the same file structure including a csv for the meta data, a source_inventory csv file and a folder containing the individual datatable csv.
.
├── meta.csv
├── raw_data
├── source_inventory.csv
└── tables
    ├── Numbers-Fives__Historic__Numbers_2020.csv
    └── Numbers-Ones__Historic__Numbers_2020.csv````